Background
In enterprise and ISP environments, maintaining network uptime and understanding traffic flow is critical. Traditional monitoring tools often suffer from outdated user interfaces, monolithic architectures that are hard to scale, or licensing models that don't fit internal, self-hosted requirements. Netsee was conceptualized to bridge the gap between enterprise-grade backend reliability and a modern, aesthetically pleasing frontend experience.Problem
- Scalability Issues: Legacy tools struggle to handle high-concurrency polling without consuming massive amounts of system resources.
- Siloed Data: Correlating SNMP bandwidth data, ICMP ping latency, and HTTP/SSL website statuses usually requires multiple disjointed tools.
- Poor User Experience: Many existing solutions have steep learning curves and lack intuitive, real-time dashboards.
- Data Privacy: Cloud-based SaaS monitoring tools require sending sensitive infrastructure topology data to external servers.
Solution
Netsee solves these issues by offering a completely self-hosted, microservices-driven platform.- It leverages Java Virtual Threads to handle thousands of concurrent ICMP pings with minimal overhead.
- It utilizes InfluxDB for highly efficient time-series data storage and retrieval.
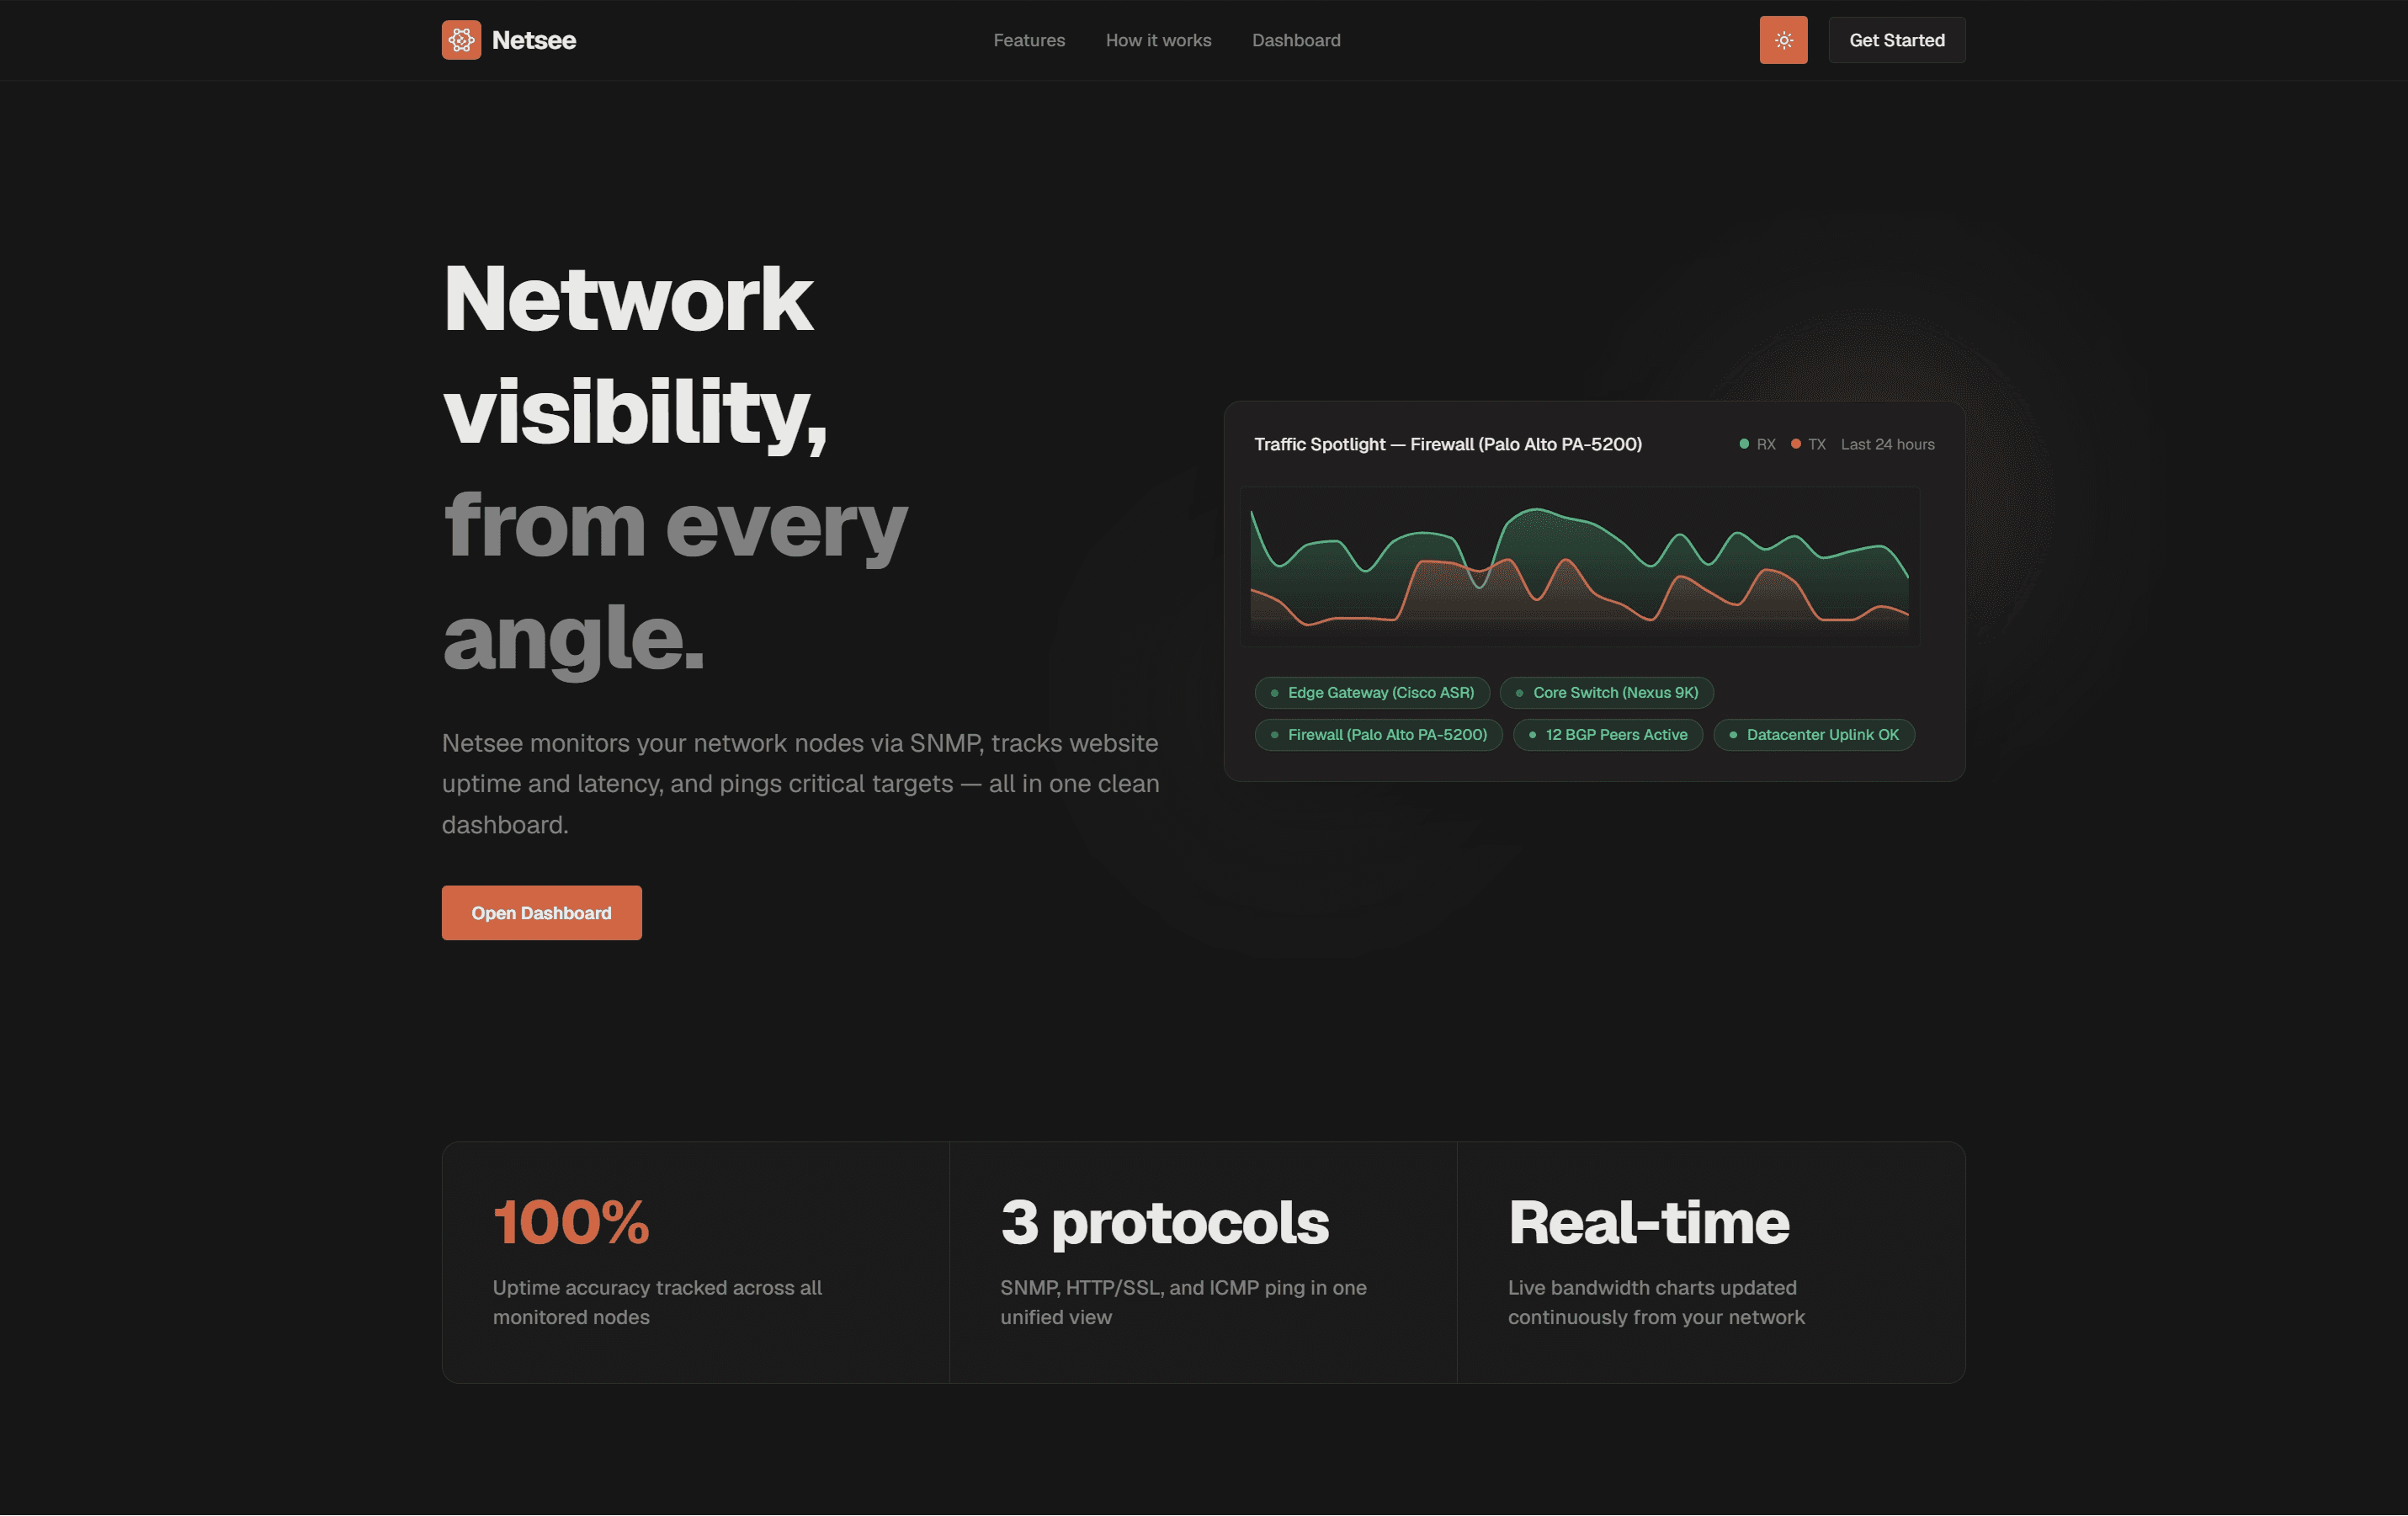
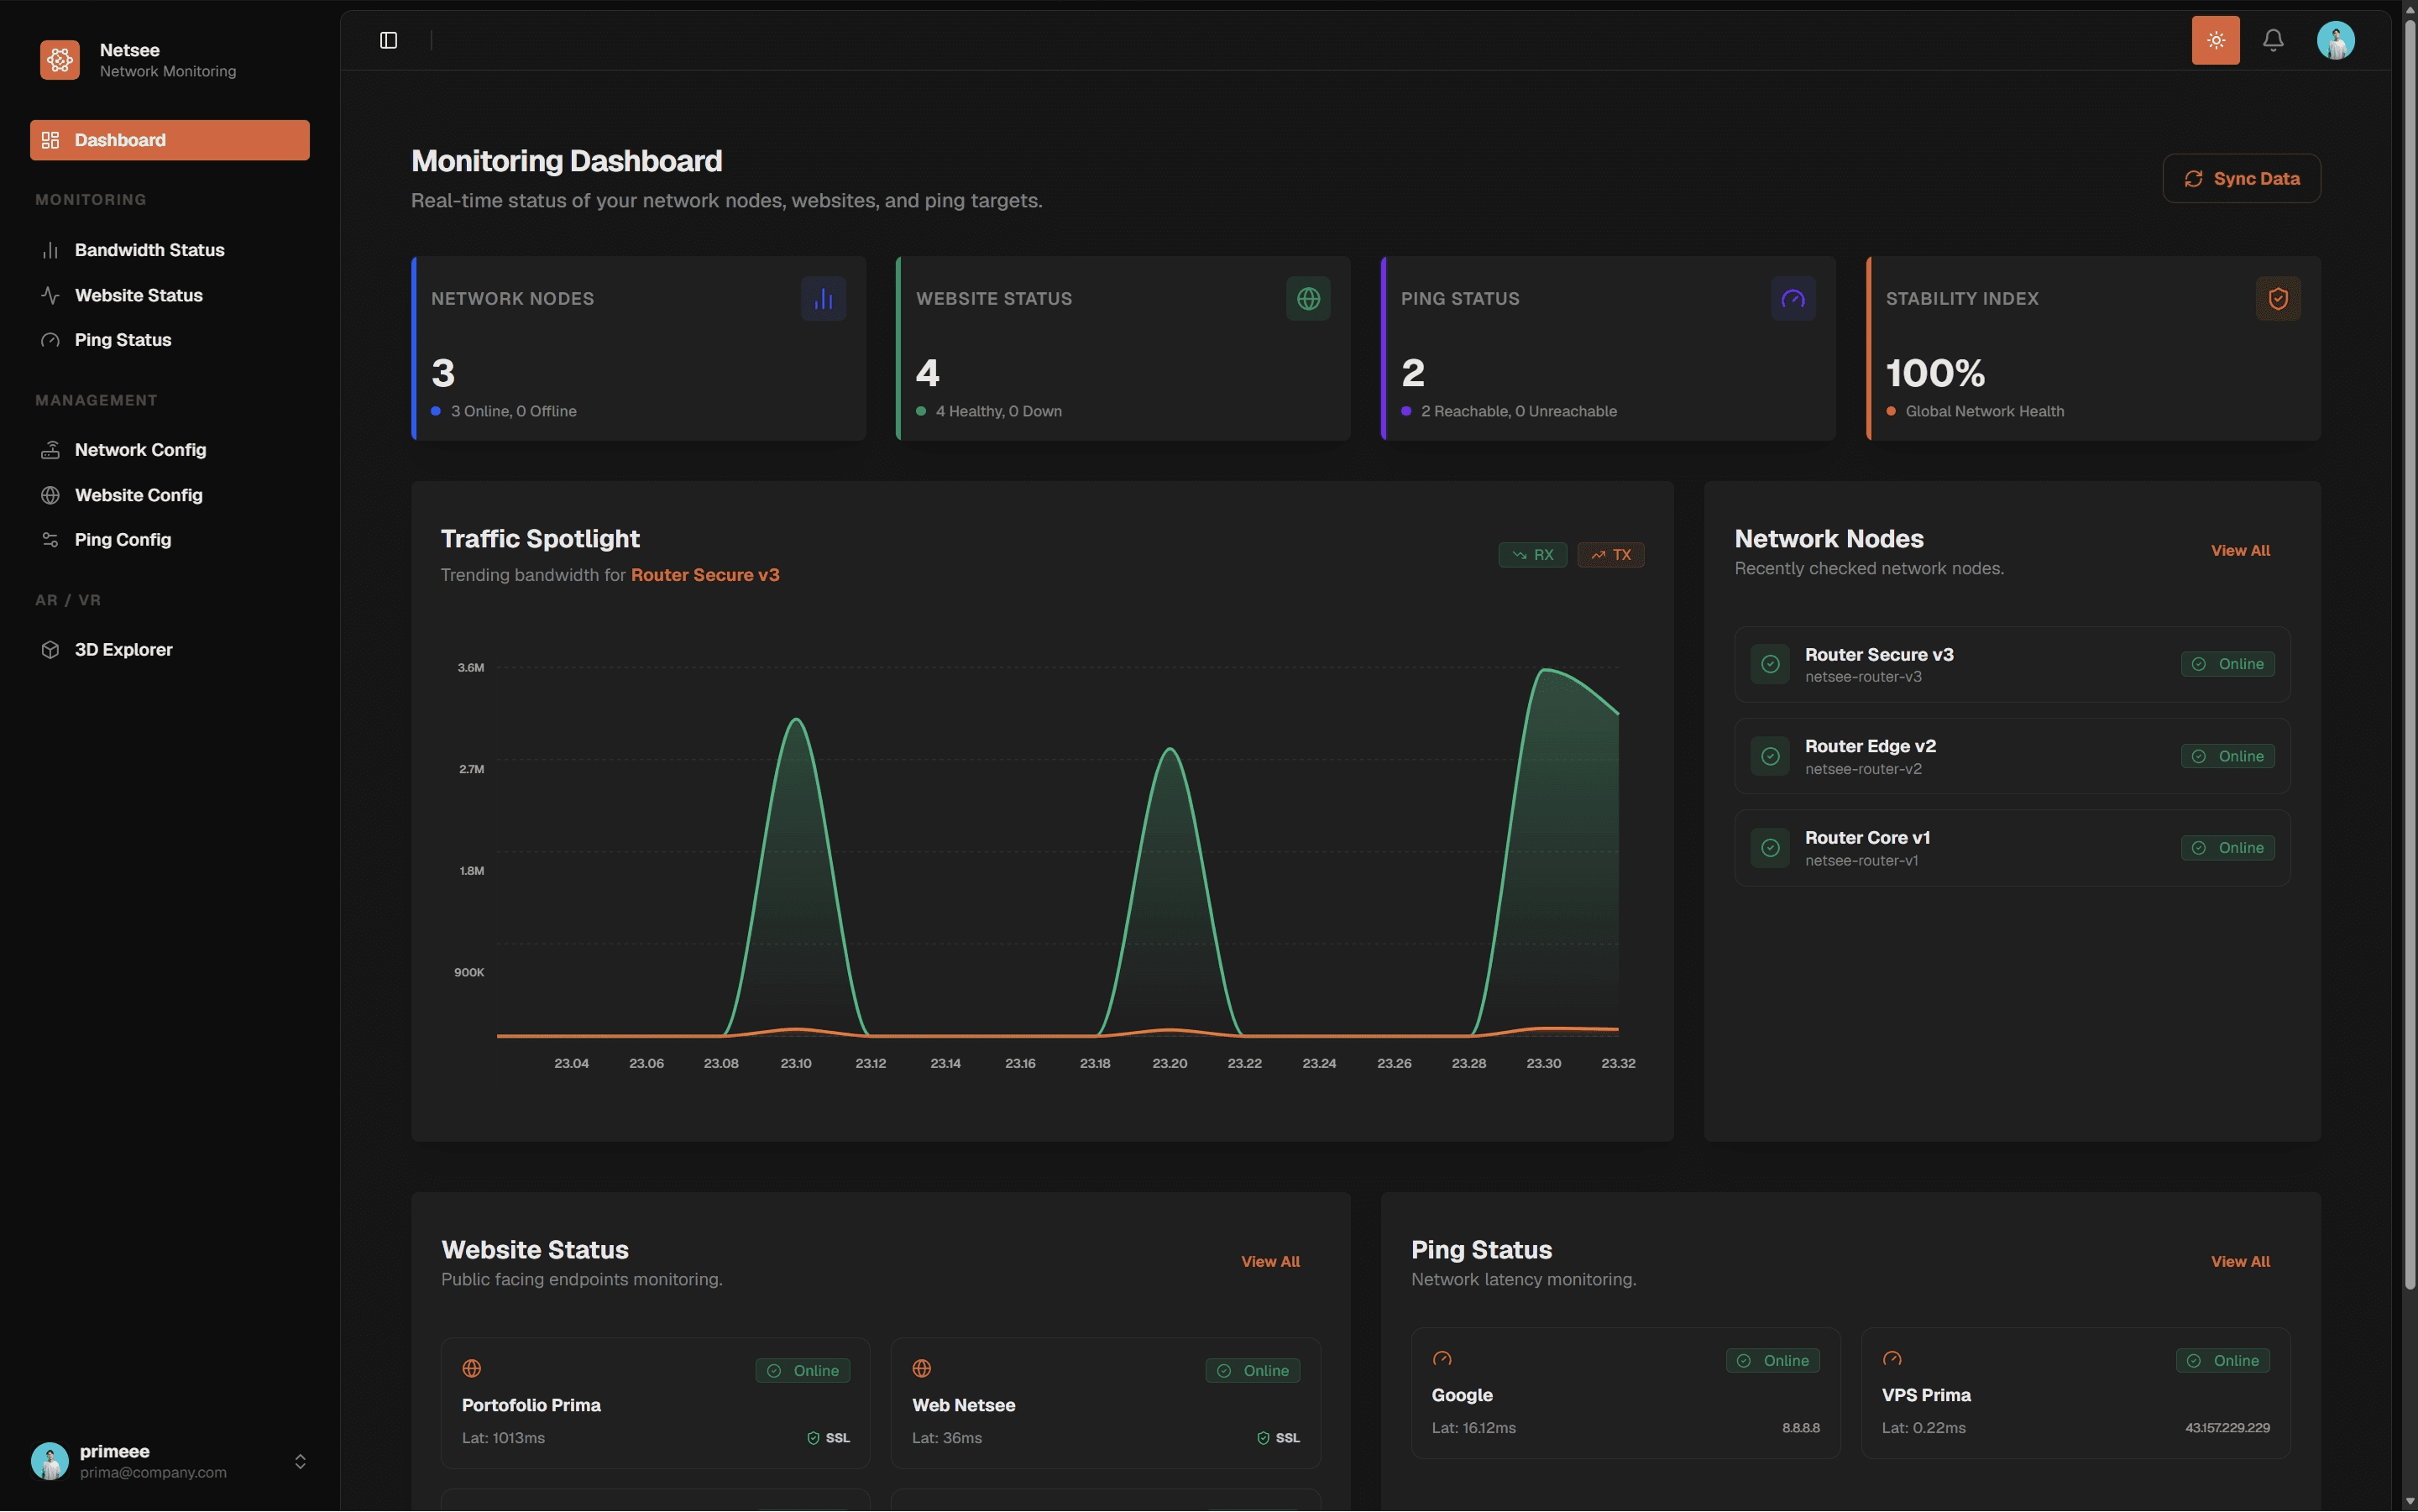
- It unifies SNMP, HTTP, and ICMP monitoring under a single, cohesive Next.js dashboard built strictly on Atomic Design principles, ensuring a seamless and modern user experience.
My Role
Lead Full-Stack Engineer / Architect- Designed the end-to-end microservices architecture and database schema.
- Developed the high-concurrency backend services using Spring Boot and gRPC.
- Built the frontend dashboard using Next.js, Tailwind CSS, and Recharts.
- Implemented the Atomic Design methodology for scalable UI components.
- Configured the Dockerized deployment pipeline.
Architecture
Netsee uses a decoupled Microservices Architecture:- API Gateway (gateway-service): Routes external traffic and handles rate limiting.
- Domain Services: Specialized services for specific domains (device-service, website-service, network-service).
- Worker Services: Highly concurrent polling engines (monitoring-service, ping-service).
- Support Services: notification-service for alerts and storage-service for reports.
- Communication: Services communicate internally via gRPC for low-latency, and expose REST APIs to the frontend.
- Data Persistence: Relational metadata is stored in Supabase (PostgreSQL), while high-velocity metrics are stored in InfluxDB.
Technical Challenges
- High-Concurrency Polling: Traditional thread-per-request models failed to scale when pinging thousands of endpoints simultaneously. Solution: Migrated the polling engine to Java 21+ Virtual Threads, allowing massive concurrency with near-zero memory overhead.
- Time-Series Data Management: Relational databases bottlenecked when inserting thousands of metrics per second. Solution: Integrated InfluxDB to handle the write-heavy workload, optimizing queries using Flux/InfluxQL for the dashboard charts.
- UI Consistency & Maintenance: As the dashboard grew, maintaining a consistent look became difficult. Solution: Strictly enforced the Atomic Design pattern (Atoms -> Molecules -> Organisms -> Templates -> Pages), resulting in highly reusable and manageable UI components.
Features
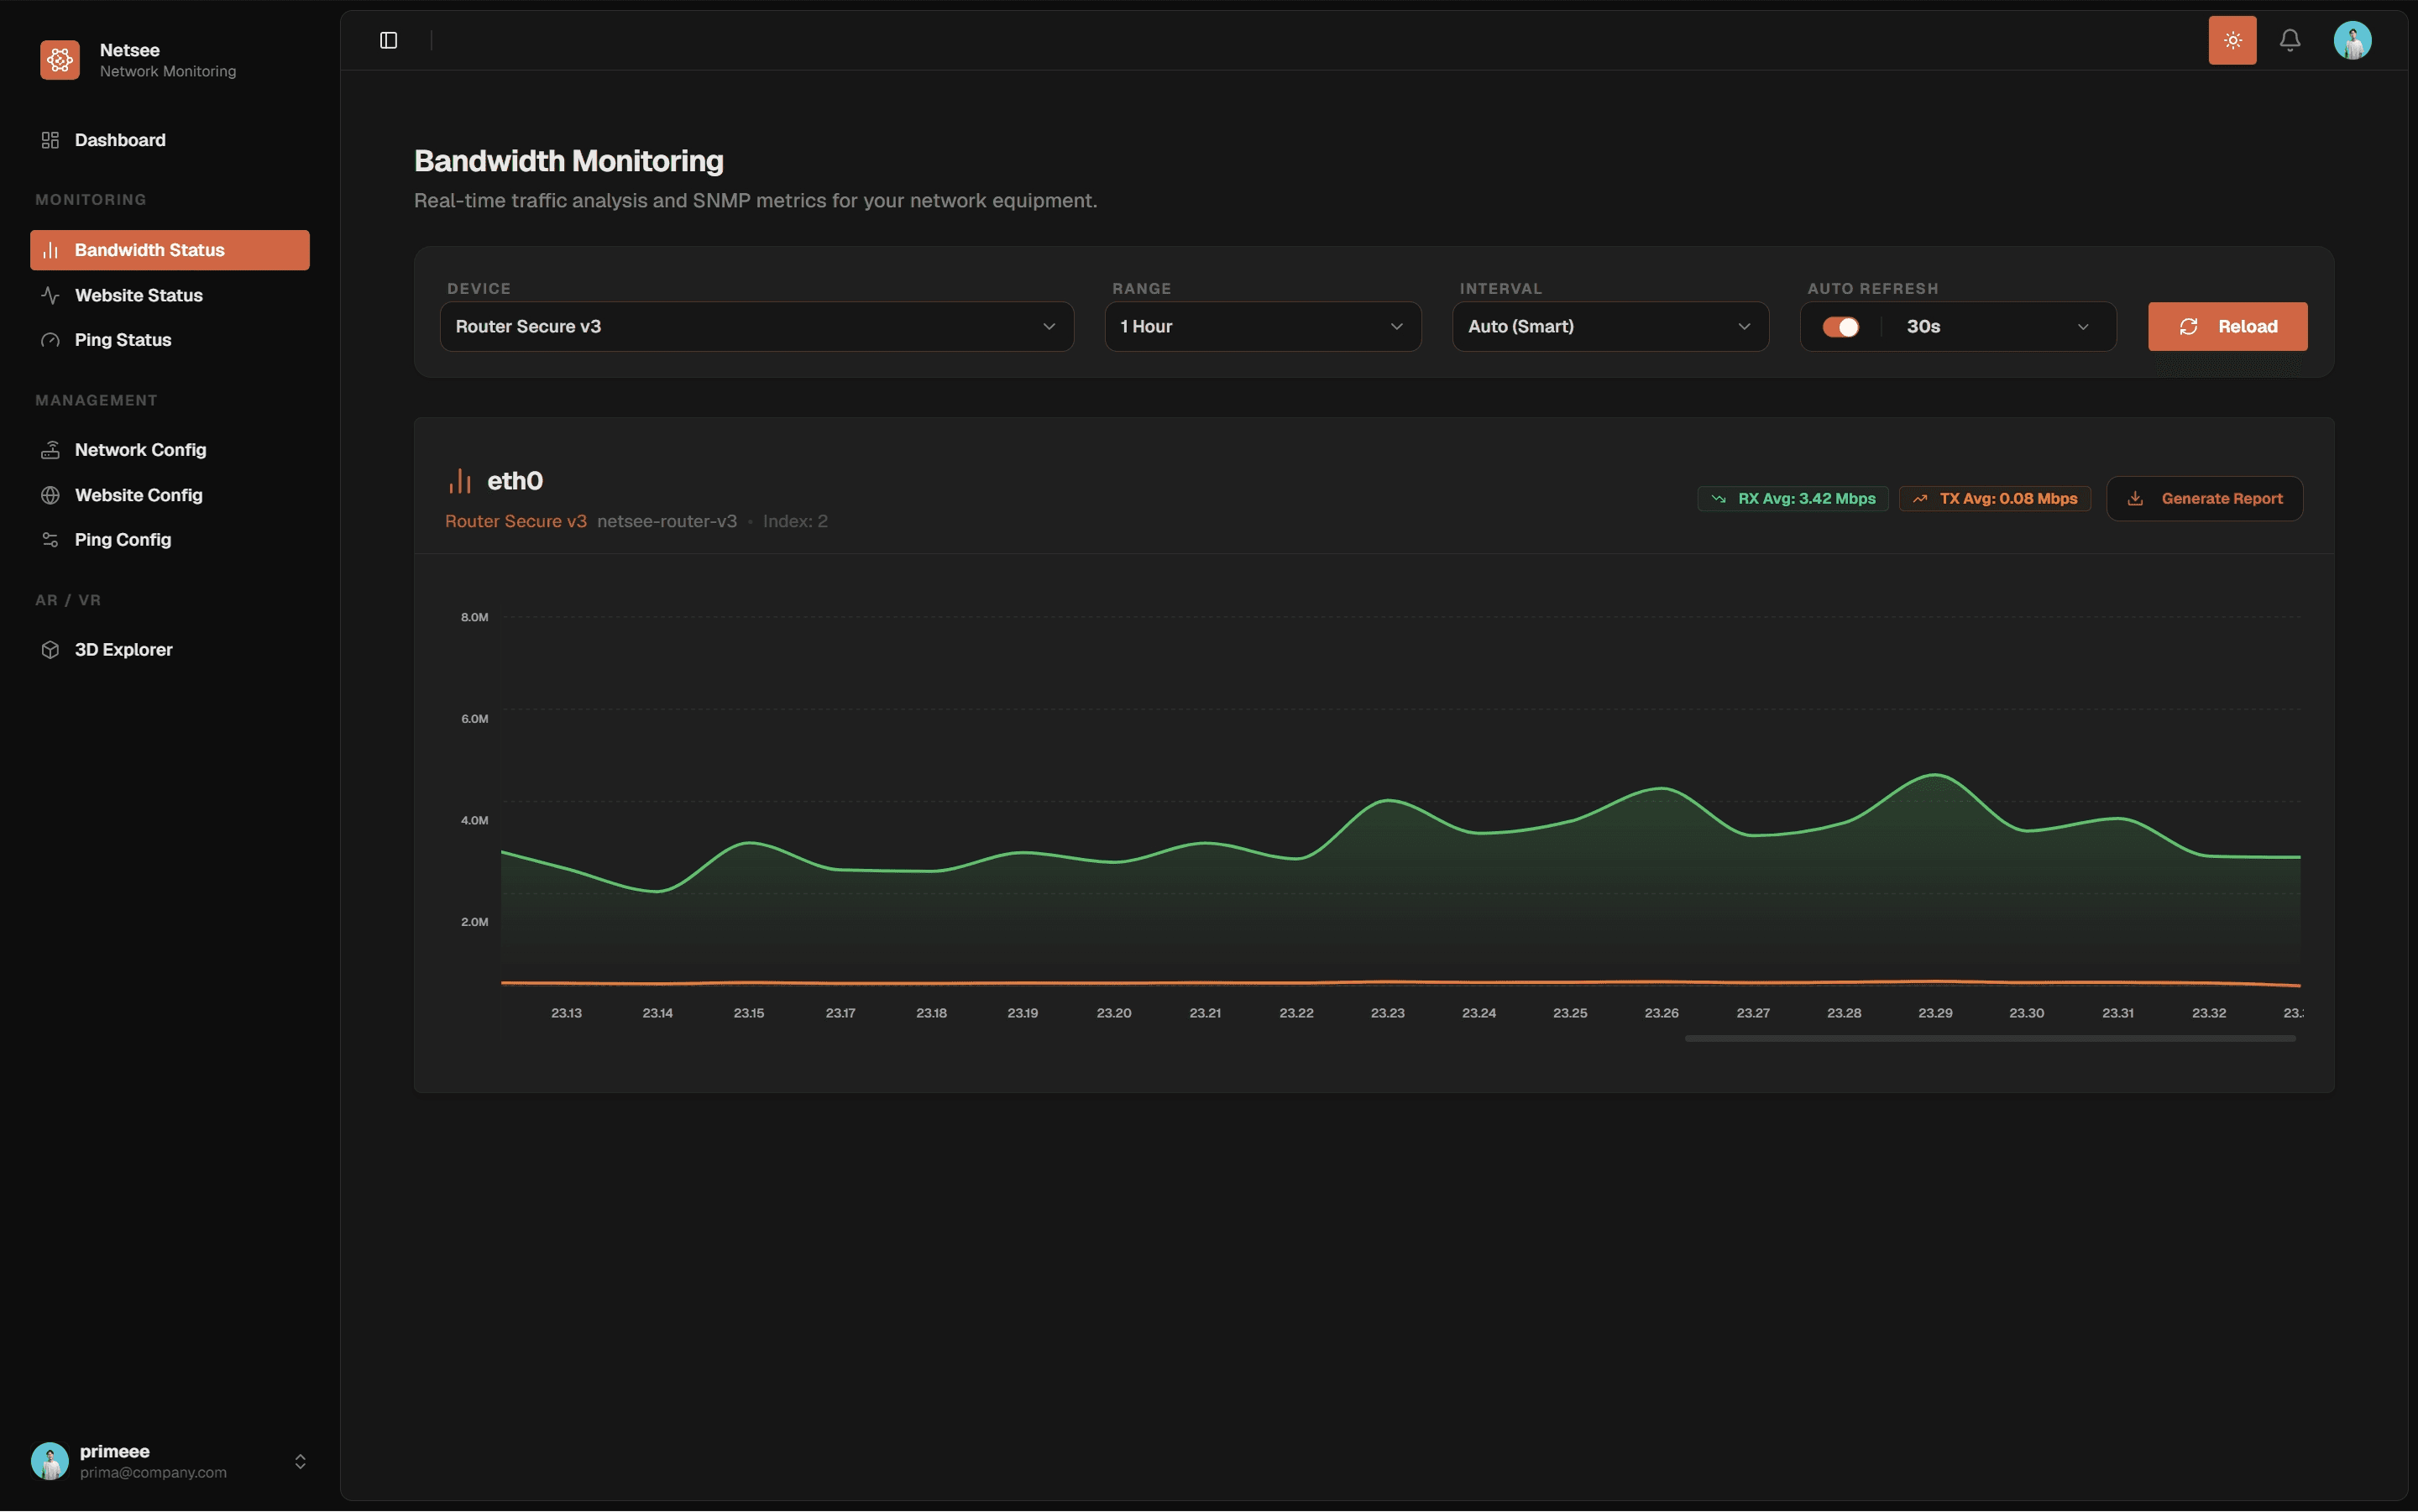
- SNMP Bandwidth Monitoring: Real-time traffic analysis using 64-bit counters (HC-Octets) for high-speed links.
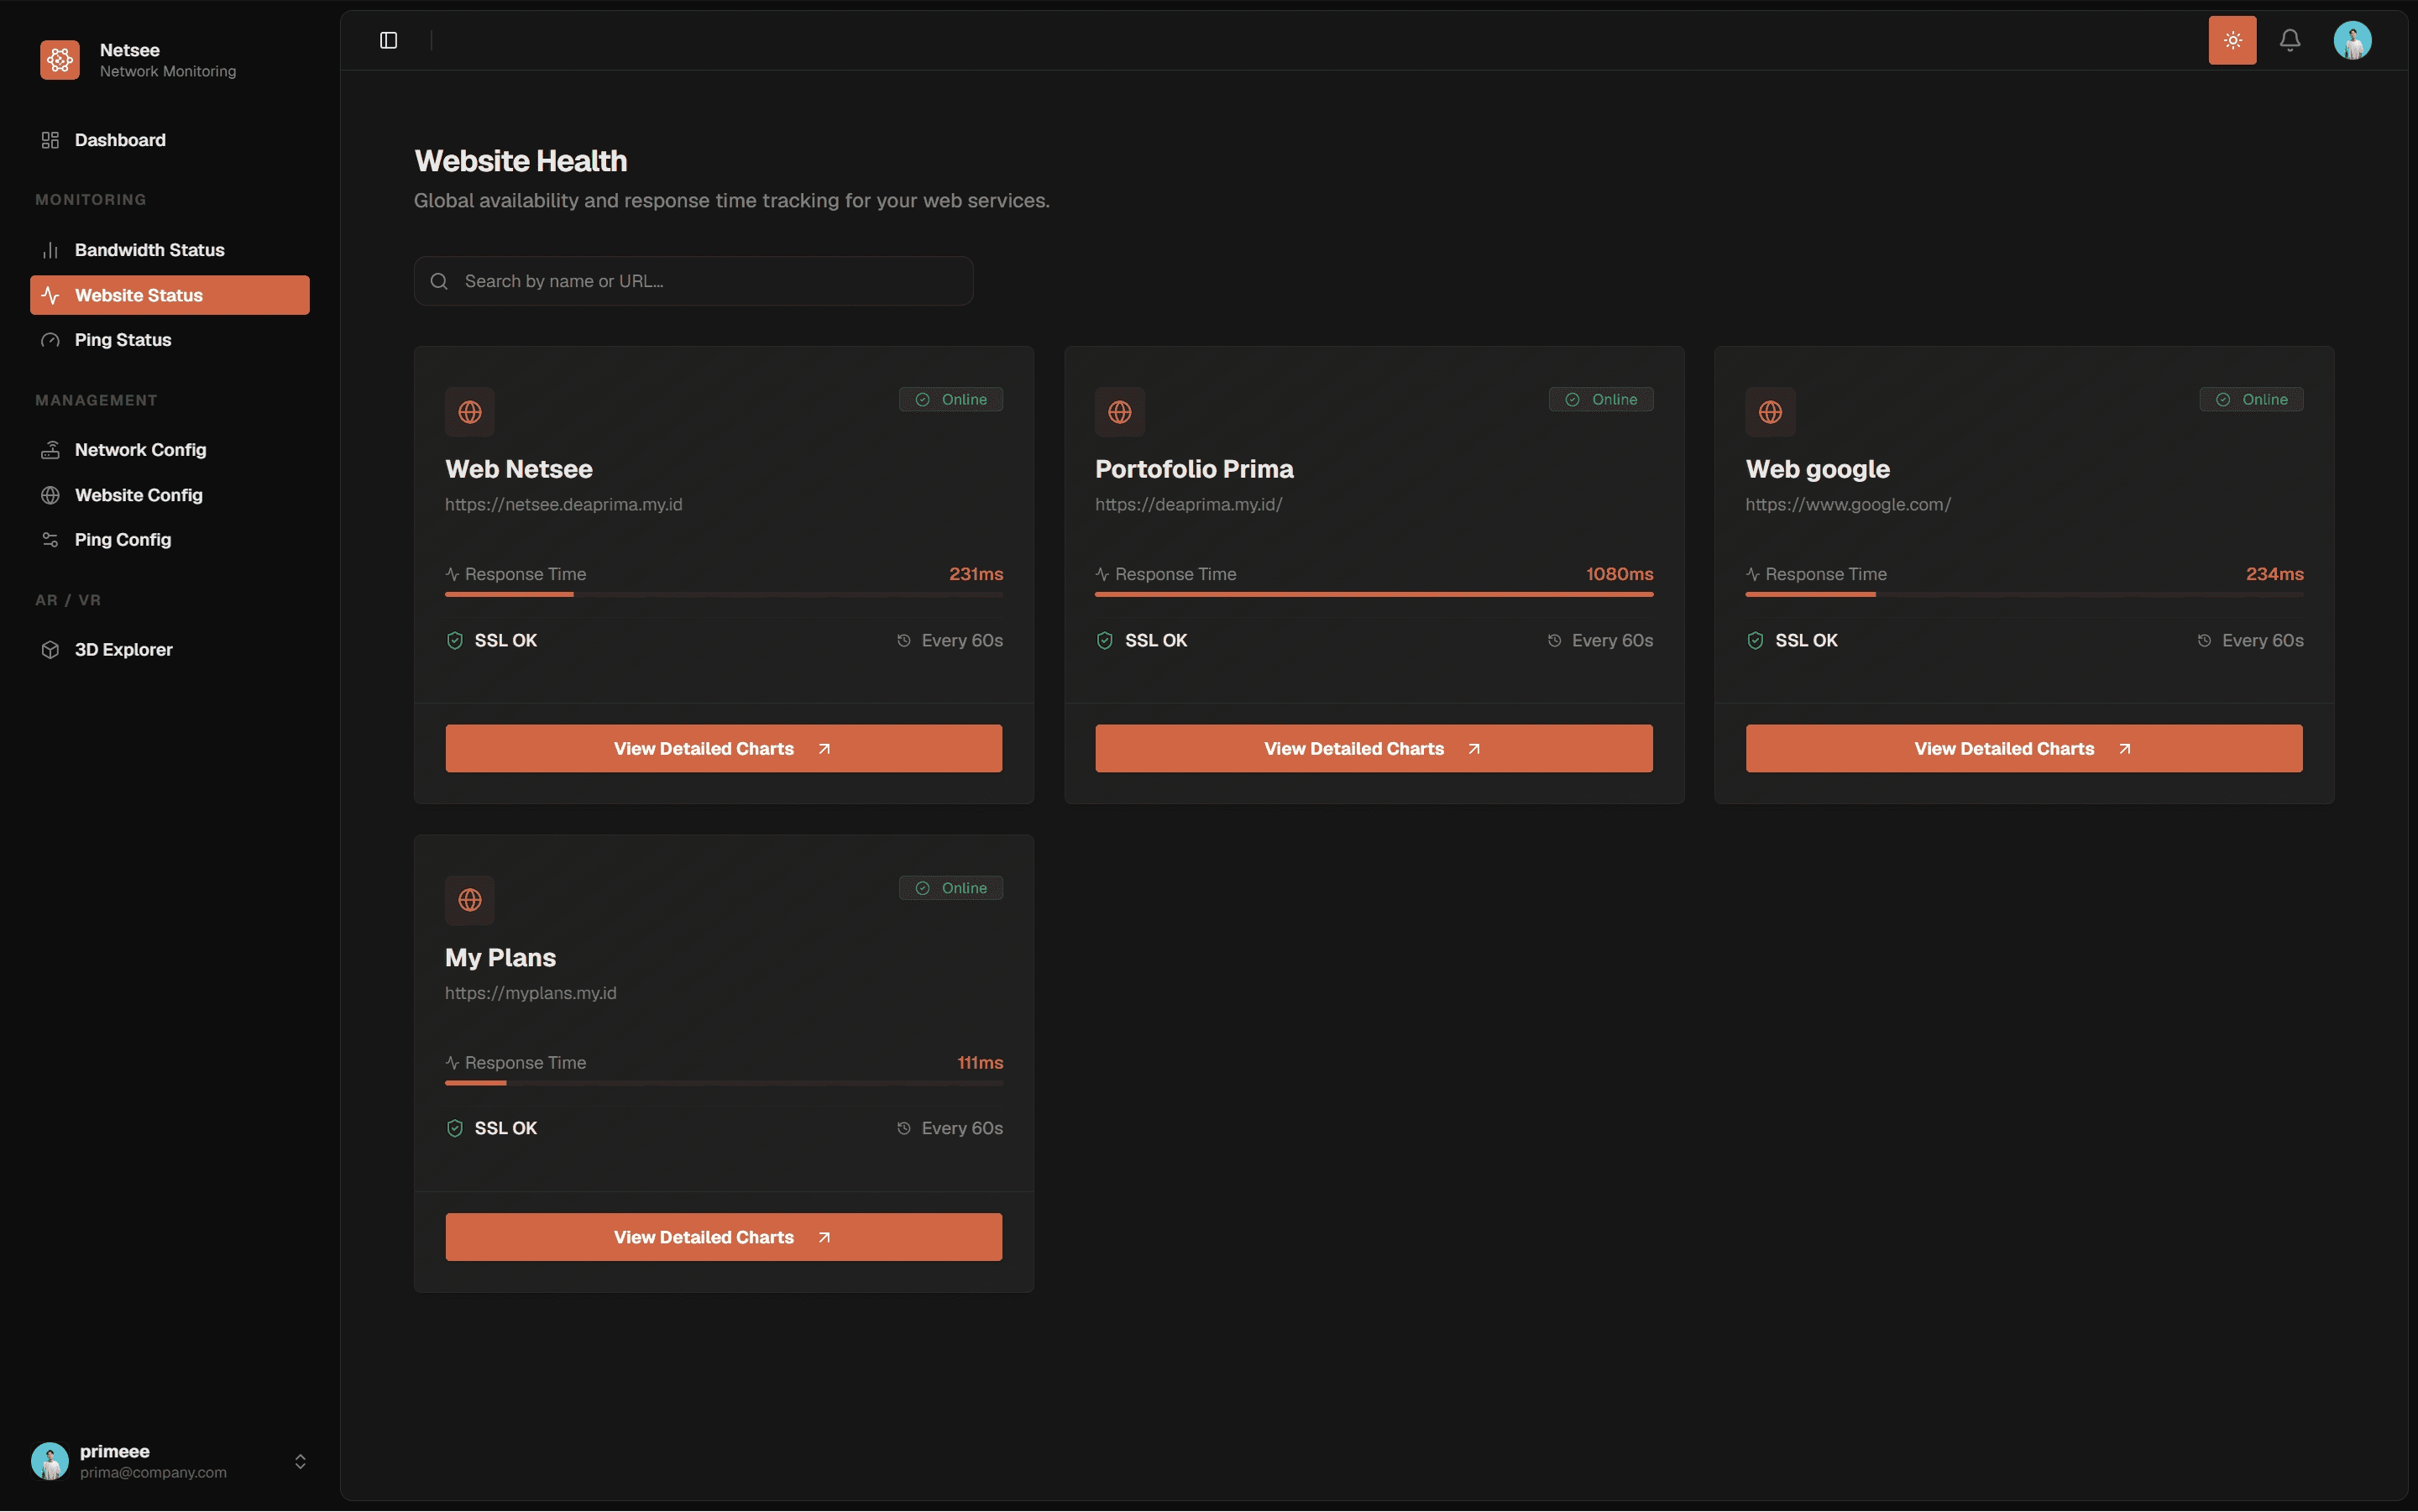
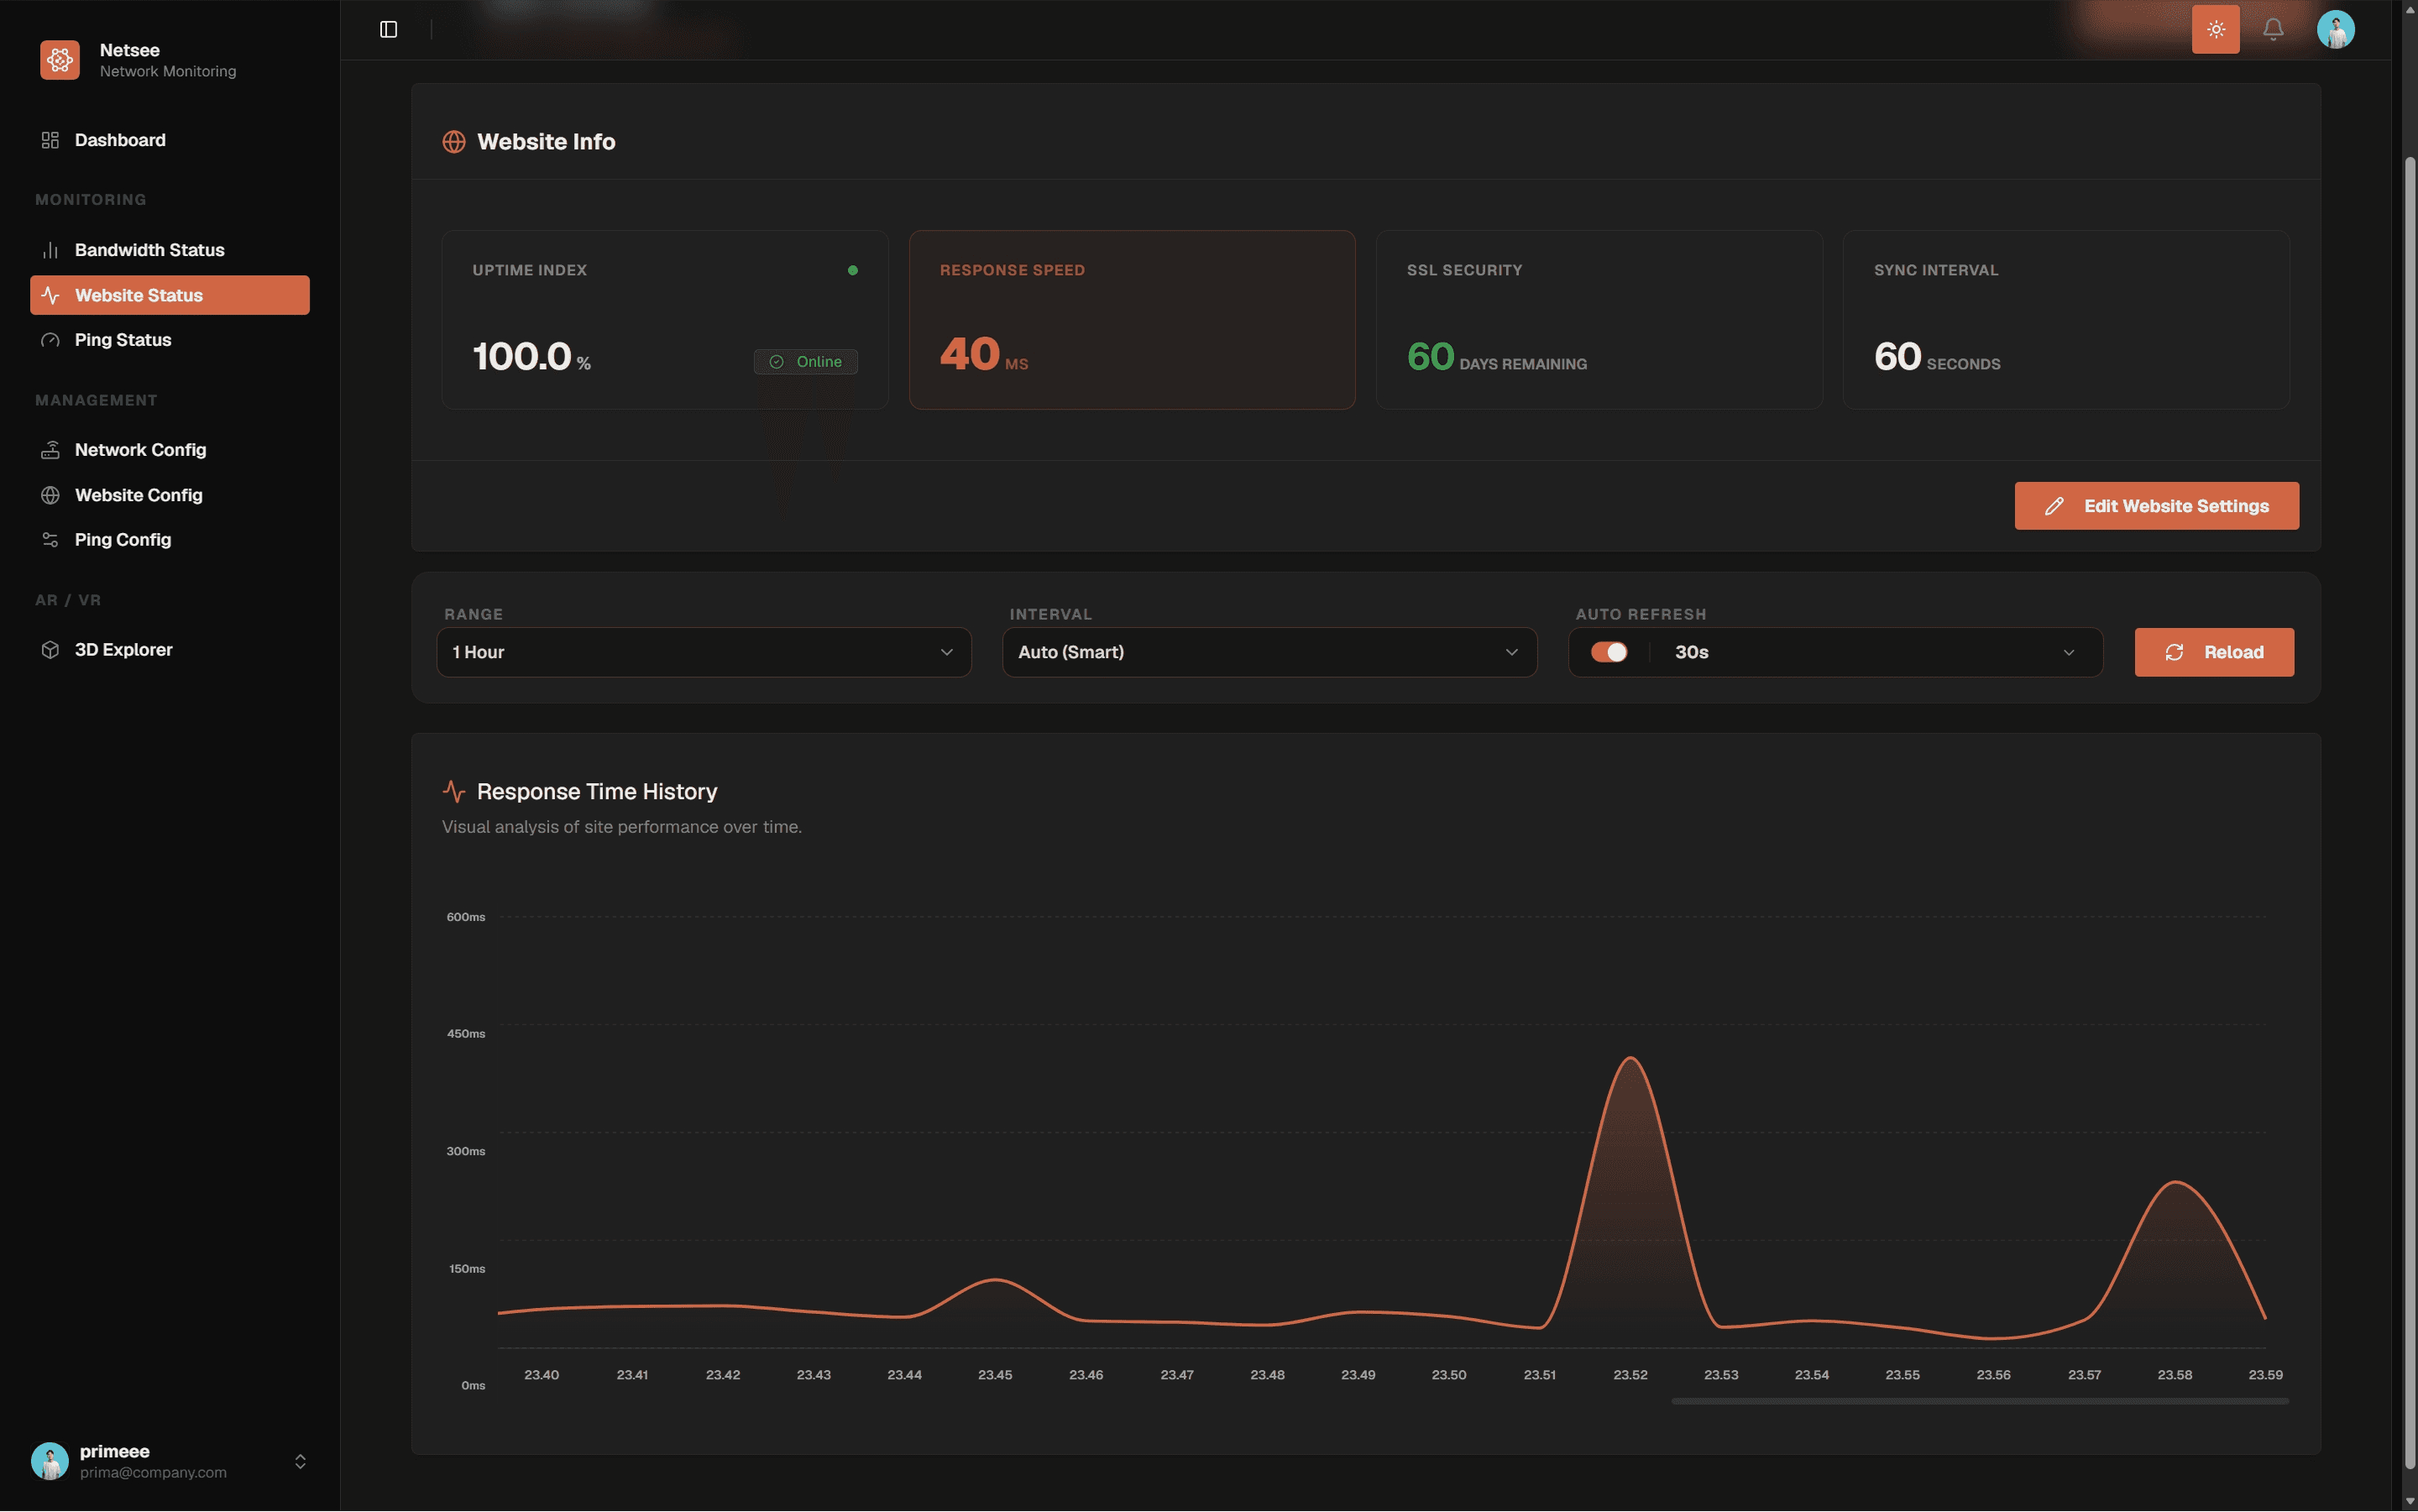
- Website & SSL Monitoring: Tracks HTTP/HTTPS statuses, response times, and alerts on impending SSL certificate expirations.
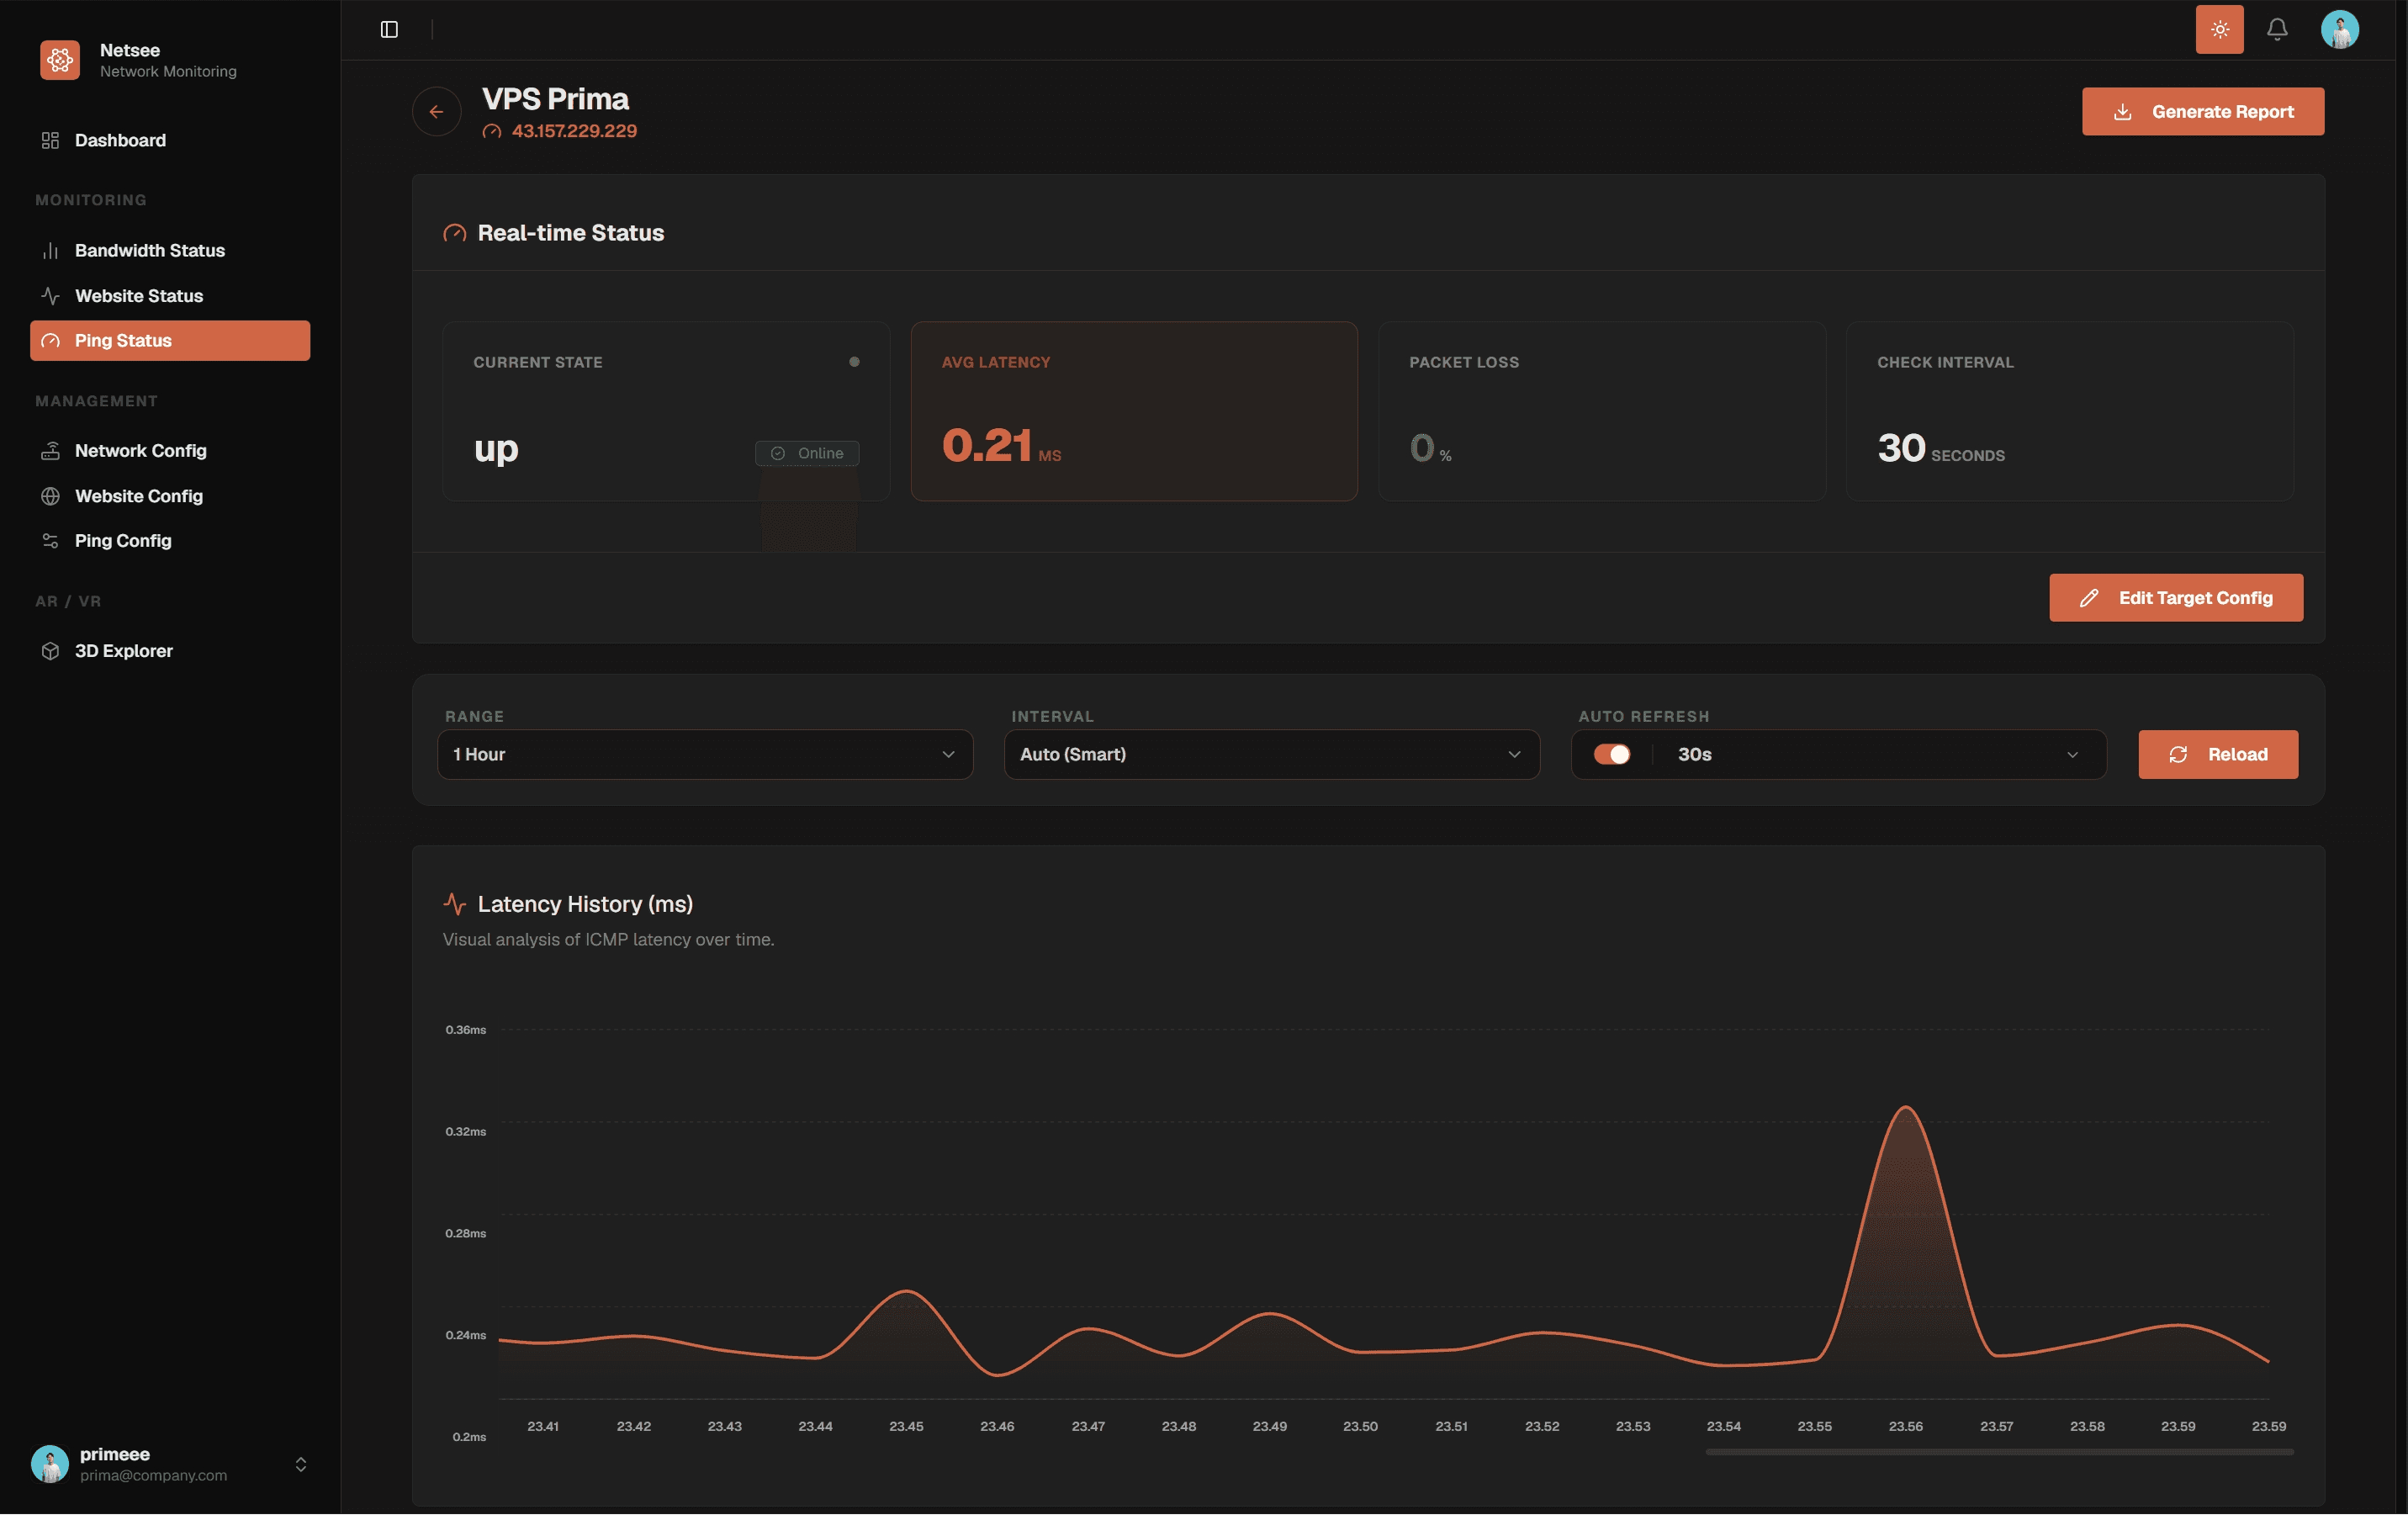
- Concurrent Ping Monitoring: Millisecond-accurate latency tracking for internal nodes.
- Intelligent Notifications: Multi-channel alerting with state-change detection and cooldown periods to prevent alert fatigue.
- Secure & Self-Hosted: Data never leaves your perimeter. Role-based access control managed via Supabase Auth.
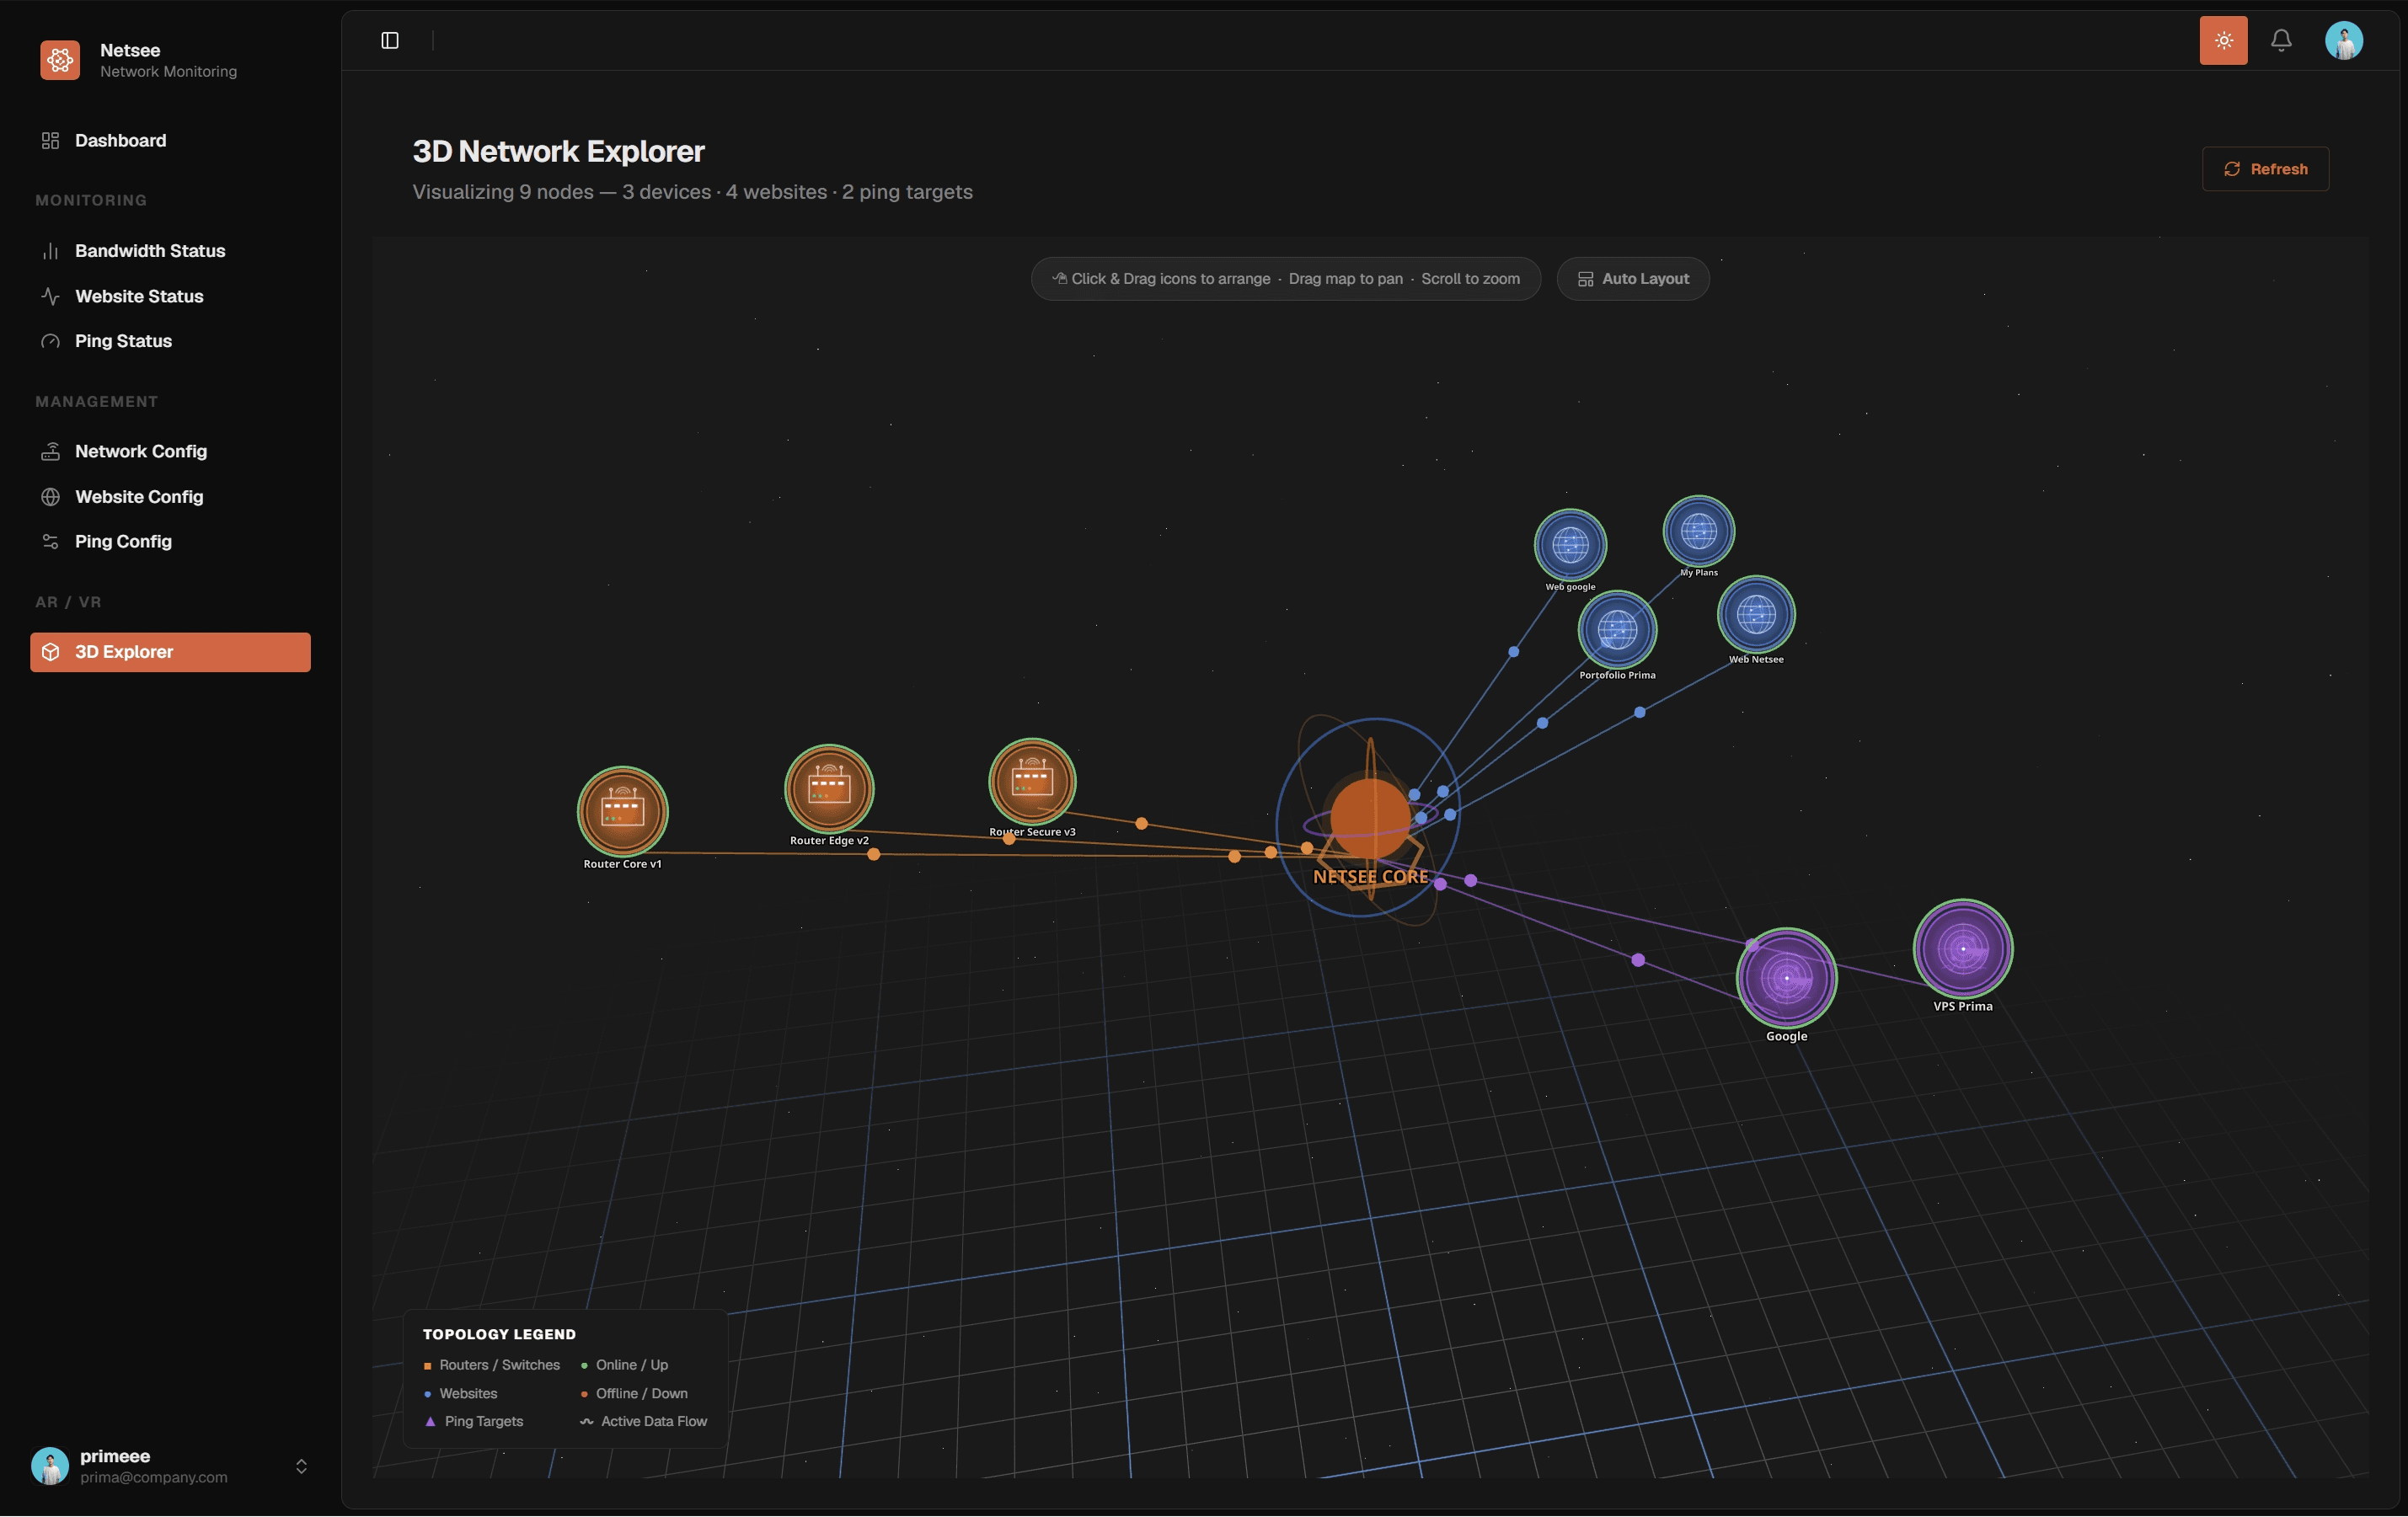
- Modern UI: Dark/Light mode support, responsive design, and interactive Recharts visualizations.
Tech Stack
Frontend:- Next.js 16 (App Router)
- React & TypeScript
- Tailwind CSS v4 & Lucide Icons
- Recharts (Data Visualization)
- Java 25 (LTS) & Spring Boot 4.0.x
- gRPC (Internal Communication)
- Spring Cloud Gateway
- Supabase / PostgreSQL (Relational & Auth)
- InfluxDB 2.7.x (Time-series Metrics)
- Redis (Caching & Rate Limiting)
- Docker & Docker Compose
Results
- Successfully deployed a production-ready monitoring stack capable of tracking hundreds of devices in real-time.
- Reduced the visual clutter and cognitive load for network administrators through a highly organized, Atomic Design-based UI.
- Eliminated external data privacy concerns by creating a 100% self-hosted environment.
Lessons Learned
- gRPC vs REST: Learned the immense performance benefits of using gRPC for internal microservice communication over traditional HTTP/REST.
- Component Scalability: Experiencing firsthand how Atomic Design prevents frontend codebases from turning into "spaghetti code" as they grow.
- Cloudflare Mechanics: Understood the nuances of reverse proxies and how they interact with Push vs Pull data ingestion models in monitoring setups.
Future Improvements
- AI Anomaly Detection: Integrating machine learning to establish baseline network behavior and alert on deviations rather than static thresholds.
- Custom Dashboard Builder: Allowing users to drag and drop widgets to create personalized monitoring views.
- Auto-Discovery: Automatically scanning subnets via ARP/SNMP to find and register new networking equipment.